CLIMATE PHYSICAL AND ADAPTATION RISK
Measure, Manage and Adapt







Clarity in a climate of uncertainty.
The Climate Digital Twin (CDT™) was built to answer one central question: how do we plan for what has never happened before in history?
Our platform enables investors and business leaders to adapt with precision. We do this by creating a dynamic twin of the future, built not on assumptions, but on probabilistic models, rigorous data, and a belief that proactive action can prevent loss and reveal upside in uncertainty.
One platform. Global coverage. Precision impact.
Tail Risk Visibility
Uncovering low-probability, high-impact climate events before they become reality.
Compounding Risk Analysis
Modeling multi-hazard interactions and how climate risks accumulate across time and space.
Scenario Distribution Modeling
Supporting decision-making with a probabilistic view of climate futures, not single outcomes.
Asset-Level Precision
Zooming from global simulation down to specific value chains, assets, and properties.
Physical Asset Ready
Pre-configured with rich data on corporates, sovereigns, and physical assets-ready for analysis, ranking, and benchmarking.
Multi-Stakeholder Use
Trusted across functions—delivering consistent, enterprise-wide analysis for banks, asset managers, insurers, corporates, and public institutions.
Uncover the vulnerability of your company's physical assets and hedge.
Delivered as an open-source, one-page report, the Climate Vulnerability Ranking provides a concise, board-ready overview of corporate exposure to physical climate risk, grounded in rigorous scenario analysis incorporating billions of climate simulations.
Explore rankings across 13,000 companies - representing over $80 trillion in market capitalization - to assess any company of interest, whether it's your own or one you invest in, lend to, insure, or regulate.
Where deep climate data meets 6 million physical assets.
The CDT combines an extensive library of geospatial data with a powerful stochastic analytics engine.
Built for ease, security, and speed.
Clarity on future risk, delivered how you need it.
Built for enterprise use, the CDT is accessed via secure, intuitive tools that transform complex data into cost-effective climate risk solutions.
Tailored risk data, delivered directly to your systems
Use a web-based interface to connect with the CDT - browse, map, analyze, benchmark, upload, and download climate risk data. The VELO App supports users from early exploration to advanced, enterprise-level use cases.
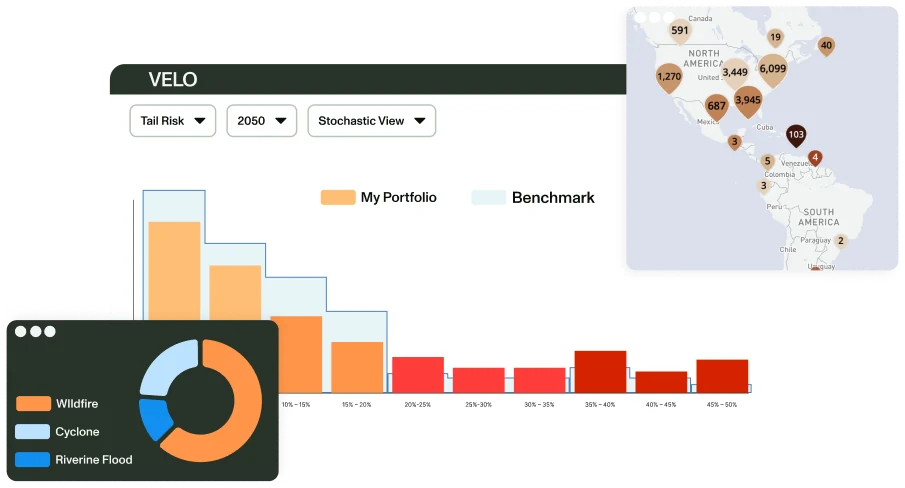
Tailored risk data, delivered directly to your systems
Use a web-based interface to connect with the CDT - browse, map, analyze, benchmark, upload, and download climate risk data. The VELO App supports users from early exploration to advanced, enterprise-level use cases.
Used by global institutions that move the market.
Identify and benchmark portfolio climate risks against market and peers
Embed climate risk into research and valuation models
Uncover hidden vulnerabilities that defy market expectations
In Practice
In Practice A global asset manager uses the CDT to rate climate risk across 25,000 equities, delivering insights to portfolio managers firm-wide.
Create value by optimizing adaptation and insurance investments across real asset portfolios
Integrate climate risks into fund strategy, due diligence, and cash flow forecasting
Understand the value and liquidity of collateral underlying private credit
In Practice
In Practice A REIT uses the CDT to automate climate risk reporting on prospective global properties during deal due diligence
Uncover climate-related concentration risks and the exposure of collateral
Embed climate analytics into credit models, stress testing, and enterprise risk management
Identify physical risk across retail, commercial, and SME loan portfolios
In Practice
In Practice A risk manager uses the CDT to assess climate risk in a 2M-property mortgage portfolio across five countries - informing loss estimates and capital planning
Enhance underwriting with forward-looking climate analytics that quantify the full range of asset-level impacts
Design innovative insurance products, such as parametric and resilience-linked policies
Conduct climate stress tests to evaluate impacts on capital planning and risk management
In Practice
In Practice A P&C insurer uses the CDT to underwrite 20-year contracts with stable pricing and improved risk alignment.
Layer climate analytics into operational decision-making to position assets for long-term performance
Identify markets poised for climate-driven growth and innovation
Simplify climate disclosures (e.g., IFRS S2, CSRD)
In Practice
In Practice An operations manager uses the CDT to quantify the ROI of a $500M adaptation initiative across the company's manufacturing facilities
Identify climate risks across raw materials, production inputs, and transport networks
Embed climate risk into supply chain optimization models
Quantify supply shortfalls to inform procurement and hedging strategies
In Practice
In Practice A Director of Agricultural Sourcing uses the CDT to identify climate-related yield shortfalls, guiding procurement strategy and cost predictability.
Pinpoint infrastructure upgrades that maximize climate resilience and public benefit
Conduct extreme weather stress tests to reveal vulnerabilities in critical infrastructure and services
Design data-driven policies to enable climate-resilient, insurable, and affordable housing
In Practice
In Practice A policy analyst uses the CDT to assess extreme weather impacts on low-income populations and design targeted programs that promote health equity.
Collaborate with financial, corporate, and policy teams using traceable, scientifically rigorous data
Deliver advanced modeling built on 50+ derived, normalized, and weighted climate indexes
Keep models current with annually updated, globally consistent climate baselines
In Practice
In Practice A scientist at a national research institute uses the CDT to validate climate models and inform improvements to regional forecasting accuracy.
Ensembles of 50+ high-resolution hazard projections available for any location on Earth.
Recognized as the global leader in climate risk analysis.

Get ahead of the climate future before it hits
See how RiskThinking.ai helps you stay ahead — with foresight and precision.
Mount Edziza Provincial Park #4 Northern British Columbia, Canada, 2012 photo © Edward Burtynsky, courtesy Nicholas Metivier Gallery, Toronto